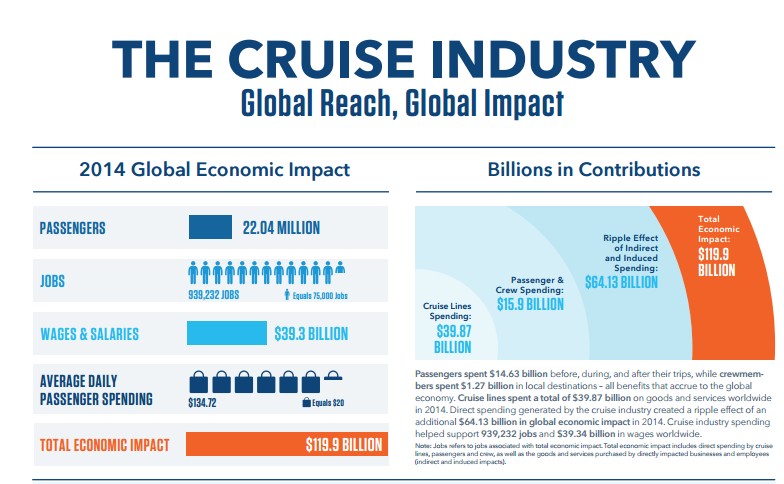
Global demand for cruising reached 22.04 million passengers in 2014, up 68 percent from 13.1 million passengers in 2004, according to a new study from Cruise Lines International Association (CLIA), the largest cruise industry trade association and the leading authority of the global cruise community. Since 2013, demand for cruising grew 3.4 percent, from 21.3 million passengers.
CLIA’s 2014 Economic Impact Analysis, an independent study commissioned by CLIA and conducted by Business Research and Economic Advisors (BREA), shows that total contributions of the cruise industry to the global economy reached $119.9 billion in 2014, up from $117 billion the previous year. This includes supporting 939,232 full-time equivalent employees earning $39.3 billion in income. Direct expenditures generated by cruise lines, passengers and crews totaled $55.8 billion.
“The cruise industry is truly a global and dynamic industry,” said Cindy D’Aoust, CLIA acting CEO. “We’ve enjoyed progressive growth over the last 30 years, driven initially by demand from North America, which expanded to Europe, Australia and now Asia. As a result, the cruise industry impacts the global economy generating jobs, income and business growth in all regions of the world.”
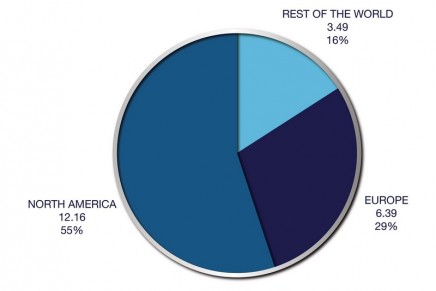
According to CLIA’s study, the global cruise industry‘s 22 million passengers are sourced from around the world. North America accounted for 55 percent or 12.2 million cruise passengers. Europe accounted for 29 percent or 6.4 million passengers. Other regions of the world, including Australia, China, Singapore, Japan and South America, accounted for the remaining 16 percent or 3.5 million passengers.
“The potential for new cruise passenger growth is huge,” said D’Aoust. “Apart from North America and Europe, other regions of the world account for nearly 85 percent of the world’s population, yet represent only 16 percent of cruisers. That reflects a tremendous opportunity for the cruise industry.”
CLIA’s 2014 Asia Cruise Trends Study shows that cruise tourism in Asia is growing at double-digit rates, both in capacity and as a passenger source market. Between 2013 and 2015, the number of ships deployed in Asia grew at a 10 percent compound annual growth rate, and the volume of cruises and voyages within and through Asia increased 11 percent. Passenger capacity in Asia increased 20 percent.
“Asia is a prime example of the cruise industry’s growth opportunity,” said D’Aoust. “The cruise industry is bringing more cruise visits to Asia and the volume of cruise travelers sourced from Asia for cruise tourism worldwide nearly doubled since 2012.”
Cruising’s Top Ten Countries in 2015:
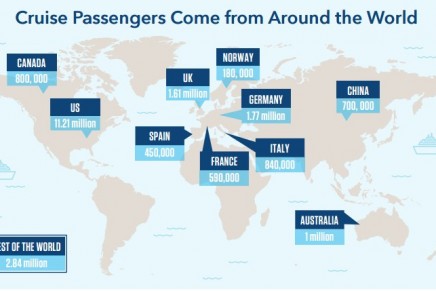
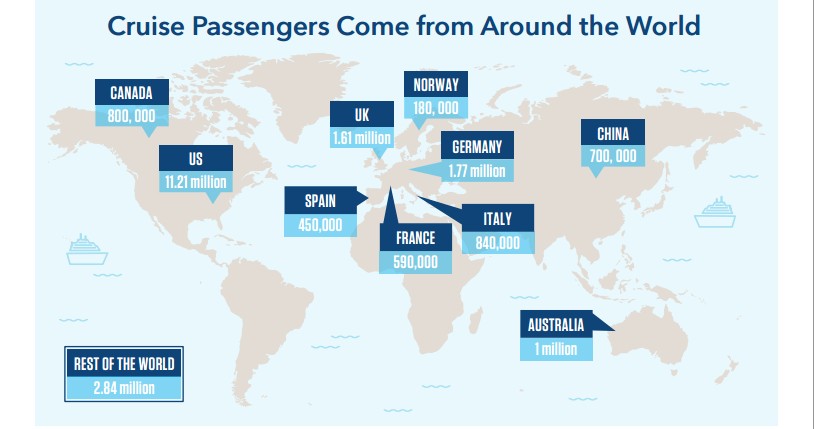
CLIA‘s study shows that a total of 19.2 million cruise passengers were sourced from the top ten countries, accounting for 88 percent of global cruise passengers. These top ten countries are located in all major global regions.
The United States, with 11.21 million passengers, sourced the largest number of cruise passengers, accounting for more than half (51%) of global cruise passengers. Germany and the United Kingdom accounted for 15 percent of global passengers (3.38 million). Australia, Italy and Canada each had more than 800,000 passengers and accounted for 12 percent of global passengers. China, France, Spain and Norway combined accounted for nearly 2 million passengers, or about 10 percent of global passengers.
CLIA’s research shows that China is a main driver of passenger growth in Asia, adding 480,000 more cruise travelers since 2012 – a nearly 80 percent compound annual growth rate. And, among the nearly 1.4 million cruise passengers from Asia, China accounted for nearly half of the regional passenger volume in 2014.
1. US: 11.2 million
2. Germany: 1.77 million
3. United Kingdom: 1.61 million
4. Australia: 1 million
5. Italy: 840,000
6. Canada: 800,000
7. China: 700,00
8. France: 590,000
9. Spain: 450,000
10. Norway: 180,000.

