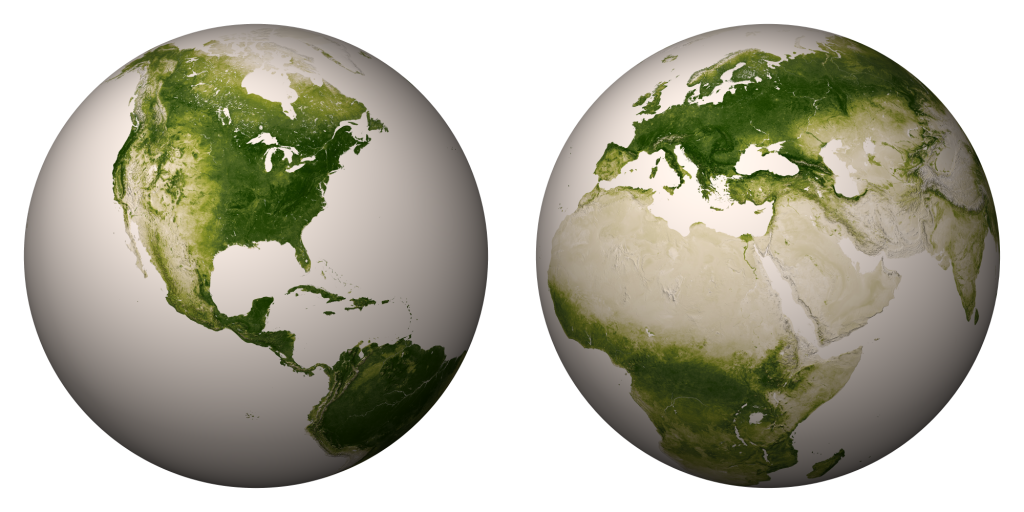
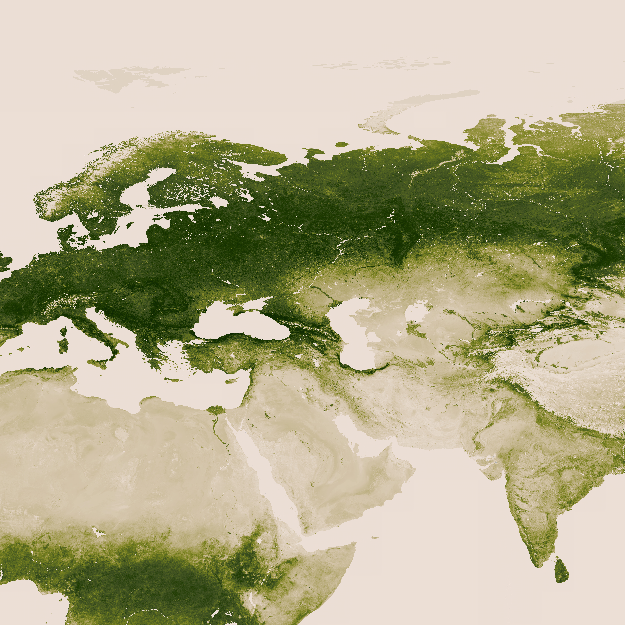
A new interactive map produced by NASA and the National Oceanic and Atmospheric Administration (NOAA) shows all the world’s vegetation. The satellite images were compiled into a single high-resolution image showing how much greenery covers the Earth.
Although 75% of the planet is a relatively unchanging ocean of blue, the remaining 25% of Earth’s surface is a dynamic green. Data from the VIIRS sensor aboard the NASA/NOAA Suomi NPP satellite is able to detect these subtle differences in greenness.
The darkest green areas are the lushest in vegetation, while the pale colors are sparse in vegetation cover either due to snow, drought, rock, or urban areas. Satellite data from April 2012 to April 2013 was used to generate these animations and images.
There are many types of indices that measure vegetation and many are calculated by using satellite data to compare the relative difference between how much energy is absorbed by the land surface versus how much is reflected back into space. Plants absorb visible light to undergo photosynthesis, so when vegetation is lush, nearly all of the visible light is absorbed by the photosynthetic leaves, and much more near-infrared light is reflected back into space. However for deserts and regions with sparse vegetation, the amount of reflected visible and near-infrared light are both relatively high. The Visible and Infrared Imaging and Radiometer Suite (VIIRS) sensor on the Suomi NPP satellite is sensitive to these different types of visible and near-infrared light.


